The Data
A Collection of Useful Data About Moreno Valley Businesses, Population and Location
0
Population
0
Median Age
0%
High School Graduates
0%
Rate of Home Ownership
Economic Development Summit
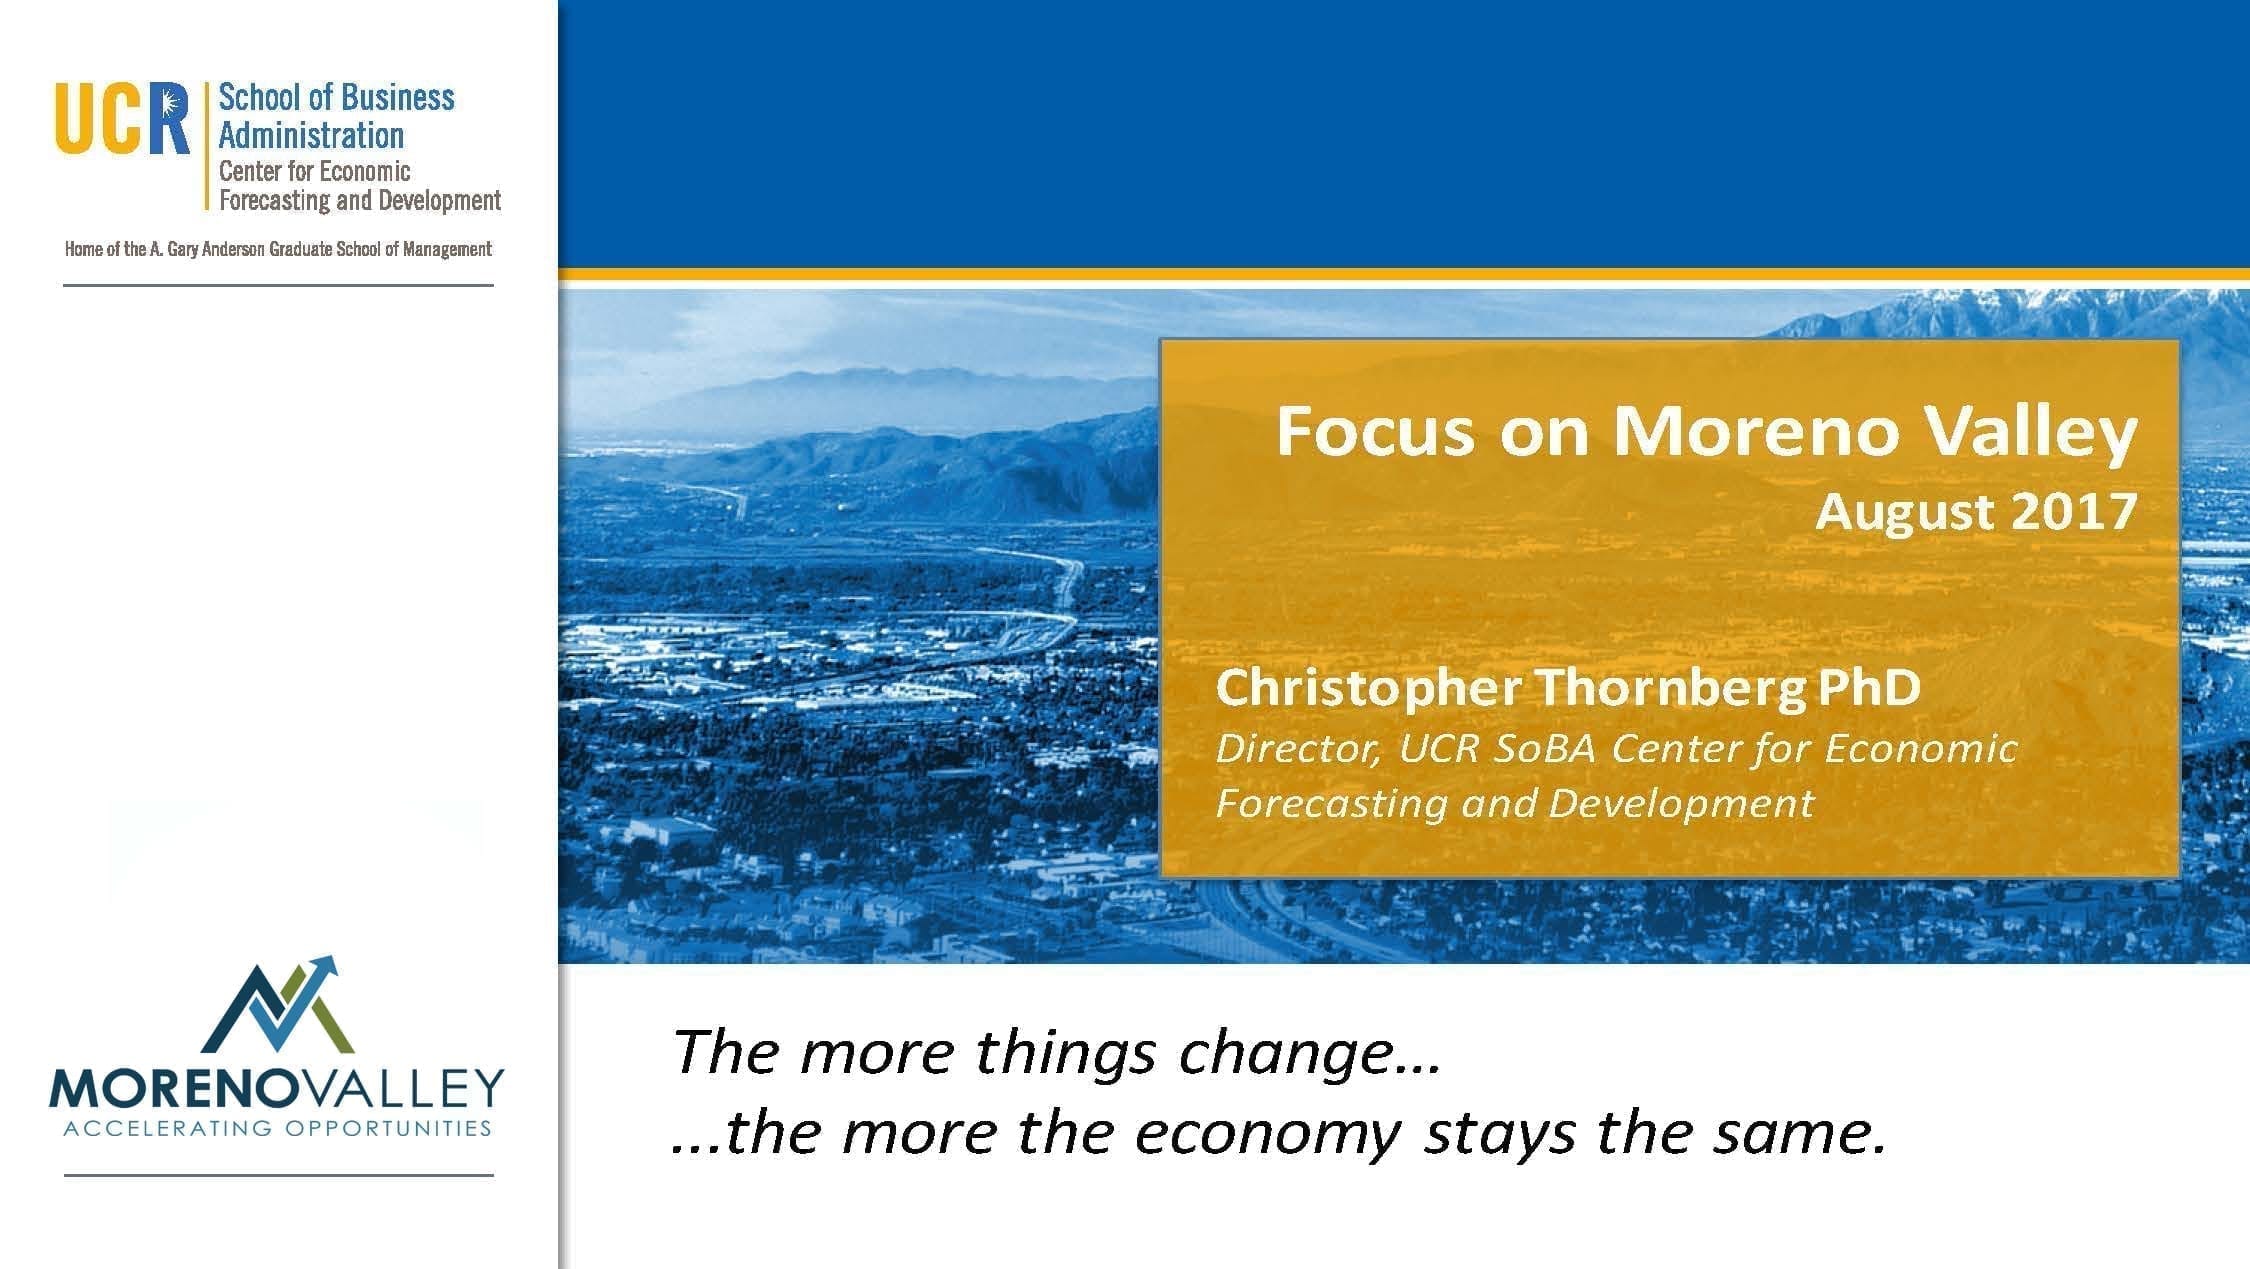
The City hosted an Economic Development Summit featuring economist Dr. Christopher Thornberg from the University of California, Riverside’s School of Business Administration. He provided economic highlights for Moreno Valley and the region.
Download the report here.

Location
| Square Miles | 51.3 |
| Time Zone | Pacific Standard |
| Elevation (feet) | 1631 |
| Neighboring Cities | Riverside Redlands Loma Linda Perris Beaumont |
Quick Facts
| Moreno Valley | Area (20 miles) | |
|---|---|---|
| Population | 214,916 | 2,440,083 |
| Forecasted 2024-29 Population Growth | 4.31% | 3.93% |
| Number of Households | 57,544 | 714,531 |
| Airports | 1 | 6 |
| Passenger Rail Stations | 1 | 13 |
| Major Regional Shopping Destinations | 2 |
| Commercial Shopping Centers | 40 |
| Total Land Parcels | 48,216 |
| Residential Parcels | 44,285 |
| Hospitals Riverside University Health System – Medical Center Beds Kaiser Permanente Beds |
2 439 101 |
| Nationally Recognized Hotels Total Rooms |
13 1,278 |
Fun Facts
| Parks and Recreation Facilities | 38 |
| Maintained Park Acreage | 531 |
| Park Rangers | 3 |
March Air Reserve Base Economic Impact
0
Base Employment
0
Other Jobs Created
| Annual Payroll | 170,000,000 |
| Base Employment | 7,500 |
| Annual Expenditure | 151,000,000 |
| Off base Lodgings | 891,000 |
| Other Jobs Created | 2,667 |
| Estimated Value of Jobs Created | 106,000,000 |
| Total Economic Impact | 428,000,000 |
| Future Projected Economic Impact | 600,000,000 |
Riverside University Health System Countywide Economic Impact
| Total Annual Expenditure | 1,140,700,000 |
| Total Employees | 6,000 |
| RUHS – Medical Center Employees | 3,400 |
| Other Jobs Created | 7,200 |
| Indirect Economic Value | 500,000,000 |
| Total Economic Impact | 1,640,700,000 |
| State and Local Tax Revenue | 107,300,000 |
Demographics
| Moreno Valley | Area (20 miles) | |
|---|---|---|
| Median Age (years) | 33.01 | 35.21 |
| Average Household Income | $101,026 | $112,910 |
| Households Earning More Than $100,000 | 22,640 39.35% |
308,770 43.21% |
| Average Household Size | 3.71 | 3.37 |
| Workforce Size | 97,299 | 1,127,389 |
| White Collar Workers | 44,224 44.45% |
585,738 51.95% |
| Average Commute Time (minutes) | 37 | 35 |
| Cars Per Household | 2.4 | 2.31 |
54.79%
45.45%
Weather
| Average High Temperature (Fahrenheit) | 78.6 |
| Average Low Temperature (Fahrenheit) | 54.3 |
| Average Days Below 32F | 0 |
| Days of Sunshine | 272 |
| Average Rainfall Per Year (inches) | 12.90 |
Economic Indicators
| Ad Valorem Property Tax | 1% |
| Sales Tax | 8% |
| Transient Occupancy Tax | 13% |
| LA-RIV-OC Regional Consumer Price Index | 249.947 |
| Number of Businesses | 4,500 |
| Fortune 500 and Global Major Employers | 23 |
Housing
0
Number of Housing Units
60.09%
$0
Average Home Price (May 2024)
83.5%
| Moreno Valley | Area (20 miles) | |
|---|---|---|
| Houses Above $200,000 | 33,650 94.4% |
417,042 91.8% |
| Owner Occupied Homes | 35,543 60.09% |
454,281 61.18% |
| Family Housing | 48,048 83.5% |
557,690 78.05% |
| Non-family Housing | 9,496 16.5% |
156,841 21.95% |
Education
48.44%
78.02%
| Moreno Valley | Area (20 miles) | |
|---|---|---|
| Some College or Higher | 65,010 48.44% |
823,537 52.15% |
| High School Diploma or Higher | 104,703 78.02% |
1,273,086 80.62% |
| Moreno Valley | Area (20 miles) | |
|---|---|---|
| 4 Year/Universities | 0 | 11 |
| Junior/Post Secondary Colleges | 2 | 27 |
| Total Public K-12 Schools | 42 |
| Elementary Schools | 27 |
| Middle Schools | 8 |
| High Schools |
7 |
| Charter Schools | 2 |
| Private Schools |
4 |
| Major Colleges and Universities | ||
|---|---|---|
| UC Riverside | Graduate Students Undergraduate Students |
3,341 20,581 |
| Cal State San Bernardino | Graduate Students Undergraduate Students |
2,396 17,854 |
| Cal Baptist University | Total Students | 11,046 |
| Moreno Valley College | Total Students | 10,684 |
| Total Area Student Population | 65,902 | |
Lifestyle
Moreno Valley has many cultural amenities and performance events that enhance the quality lifestyle of its residents.
| Nationally Recognized Movie Theaters Number of Theater Seats Number of Screens |
2 5,825 24 |
| Number of Bowling Allies | 2 |
| Number of Karaoke Bars | 6 |
| Parks, Trails, and Park Facilities (acres) |
352 |
| Number of Major Hiking Trails | 6 |
| Miles of Trails |
32.3 |


